• Skip to main content
  • Skip to footer

Dyspatch

  • Products
      • Overview
      Features
      • No-code email builder
      • Email collaboration
      • SMS builder
      • AMP for Email
      • Template localization
      • Expert services
      • Partners & integrations
      •  
      Find your fit
      • Tools for email Designers
      • Dyspatch for translators
      • Email production for Marketers
      • Resources for email Developers
      Sendwithus Logo
      • Overview
      • Analytics
      • A/B testing
      • Triggered emails
  • Pricing
  • Case studies
  • Resources
    • Blog
    • Free templates
    • Webinars
    • Ebooks, guides, & reports
  • Company
    • About us
    • Careers
    • Contact us
  • Login
    • Dyspatch
    • Sendwithus
Get a demo

The Highest Quality List of Email Marketing Statistics for 2025

By Jessie Strongitharm | December 8, 2024 | Categories: Email Marketing
⏱ 10 minute read

We all know quality over quantity. But when it comes to email marketing statistics in this day and age, it can be hard to tell those two apart.

Let’s face it: There’s a ton of data out there vying for our attention. And as marketers, we know how important it is to let the hard facts guide our decisions.

But what happens when those facts are faulty? 

It’s true — your stats are only as good as your sources. And these sources get misused and misconstrued all the time! Whether the data reflects a very specific industry, or the experiment was poorly conducted, or the sample size was less-than-ideal, or the info is just plain old, there are any number of things that can go wrong in our noble pursuit of a bigger picture.

In other words, the road to unsound research is paved with good intentions.

So with this in mind, I set out to compile the highest quality list of email marketing stats for 2025, leaving no stone unturned in my quest for knowledge from only best-in-class sources. 

Below you’ll find everything you need to understand the state of email marketing currently, including: 

  • Essential email marketing statistics
  • Email marketing metrics and benchmarks 
  • Email marketing ROI statistics
  • Email marketing statistics by industry (B2B + B2C)
  • Customer retention email statistics 
  • Mobile email marketing statistics
  • Interactive email statistics (video, animations, AMP for Email)

Plus, I’ve included a snapshot into the methodologies behind some of these stats, so you can have full confidence in each figure you see.

Let’s get started.

Essential email marketing statistics

Despite the growth of additional channels, like SMS, email remains the dominant channel. 

The number of outbound emails increased 15% in the last year, and continues to make up over 80% of all outbound messaging. Salesforce 

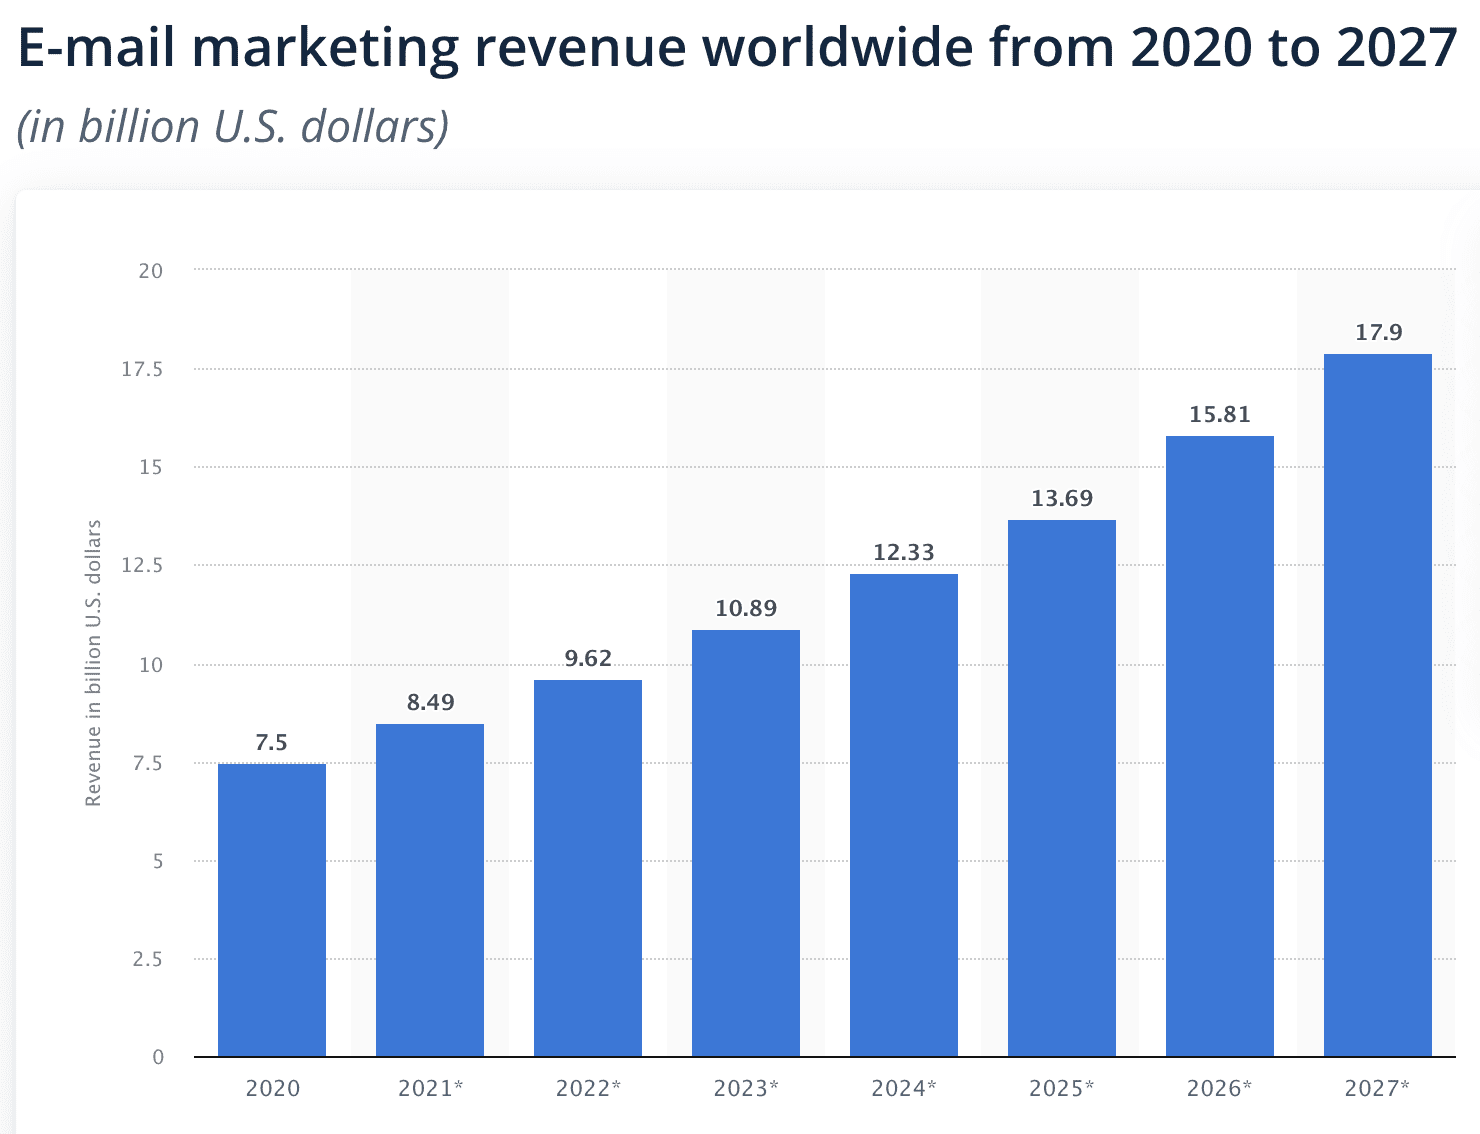
The global email market was valued at $8.5 billion in 2021; by 2027 it is expected to reach nearly $18 billion. Global Email Marketing Industry Report

Global email volume rose by 14 percent from 2020 to 2021. Initially seen as a disruption, it has become seen as the “new normal.”Validity

Bar graph depicting increasing email marketing revenues year-over-year from 2020 to 2027.

Stat spotlight

  • 82% of marketers worldwide use email marketing. Salesforce

Behind the stat: Salesforce’s data was collected from 6,950 full-time marketing leaders around the globe using a double-blind survey. (The gold standard for experiments!)

  • 42% of all emails are opened on a mobile device. Litmus 
    • This increases in younger audiences: 67% of Gen Z’ers and 59% of millennials primarily use mobile email clients. Bluecore
  • More than half (51%) of consumers prefer to be contacted by brands via email over any other channel. SmarterHQ Report
  • The average time people spend reading an email is 10 seconds, down from 13.4 seconds in 2018. Marketing Charts

Stats spotlight

  • Gmail is the most popular email provider worldwide; as of 2019 there were over 1.5 billion active “users” (i.e. email addresses). Google
  • Apple leads email client market share at 57%, followed by Gmail (30%), Outlook (4%), and Yahoo! (3%). Litmus

Behind the stats: While an email client is the application you use to access your emails on a given device, email providers are the technical service allowing you to send and receive emails, meaning your messages get stored on their servers. The percentages above were calculated from Litmus Email Analytics’ data on over 1.44 billion email opens as of January 2022 — the largest sample size available. 

Email marketing metrics and benchmarks 

Across all industries…

  • 21% is the average open rate (OR) for emails across all industries. Campaign Monitor
  • The average click through rate (CTR) is 2.3%.
  • The average click-to-open rate (CTOR) is 10.5%. 
  • The average unsubscribe rate (UR) is 0.1%.
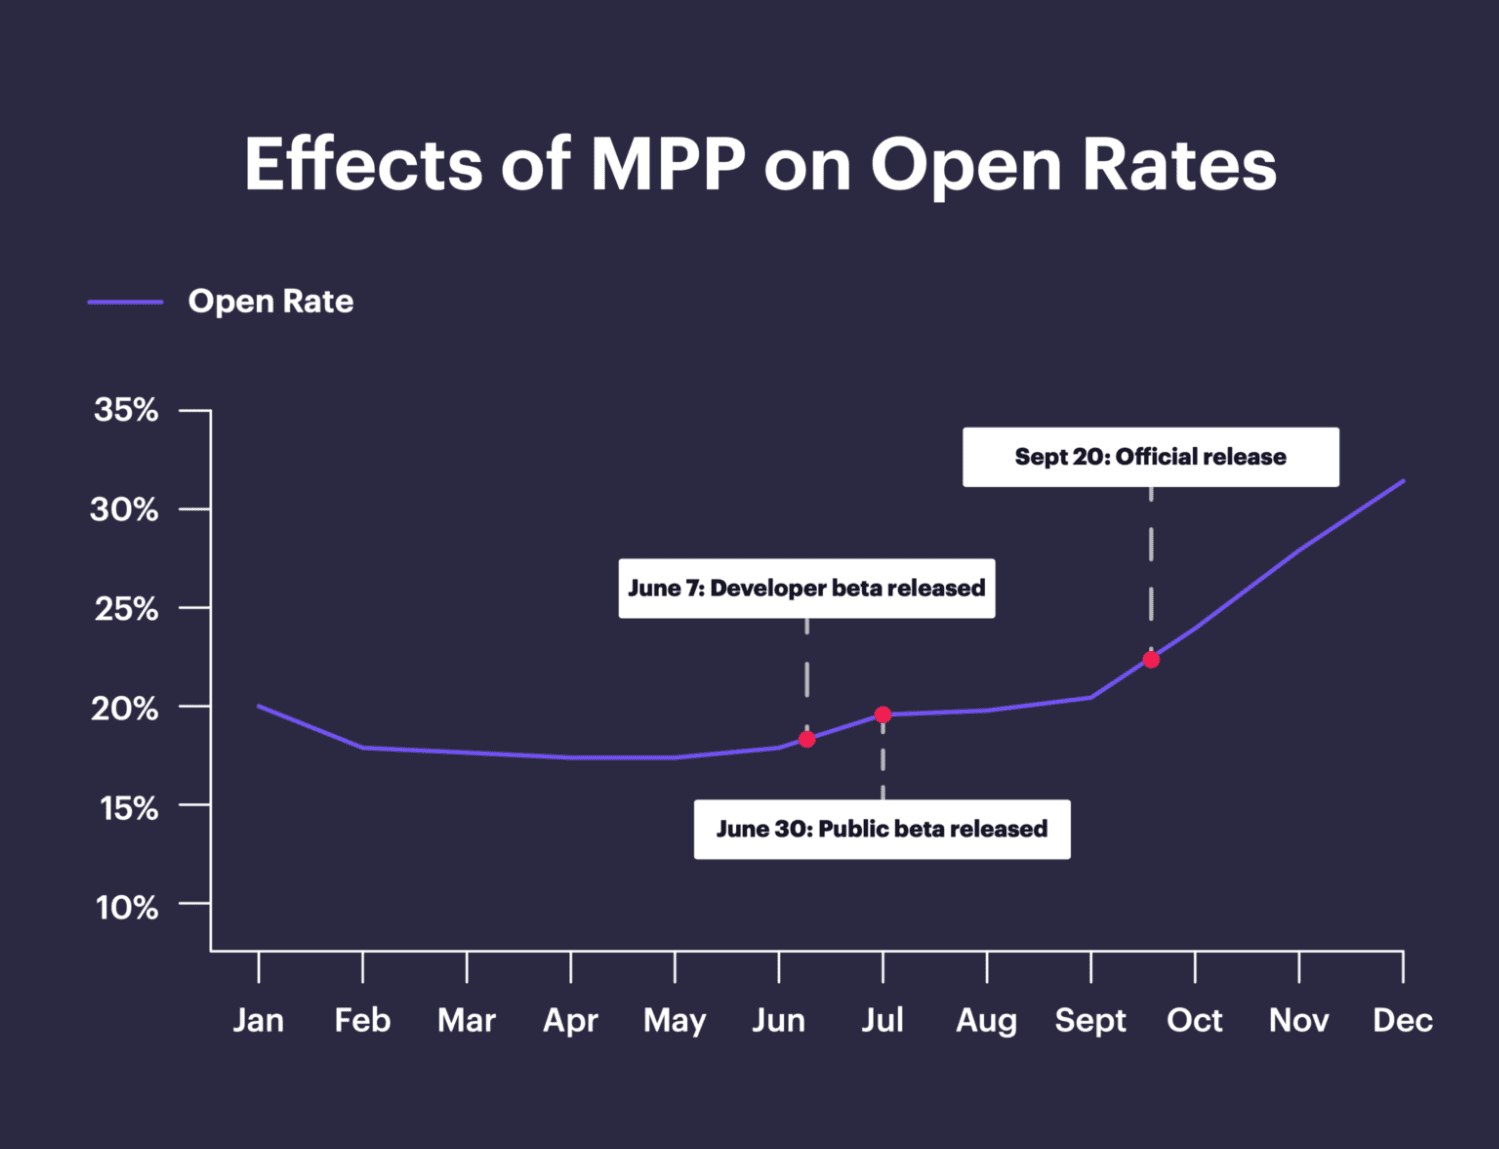
    • Note: Apple’s Mail Privacy Protection (MPP) update has caused significant swings in ORs and CTORs year-over-year — OR is up 3.5% YoY, while CTO is down 3.6%.

Line graph depicting the effect of Apple's Mail Privacy Protection update increasing open rates starting with its beta release in July 2021, increasing sharply on September 30th when it was officially released.Source

By sector…

  • Retail emails have the lowest open rate by industry (17%). Campaign Monitor
Industry Open Rates Click-Through Rates Click-To-Open Rates Unsubscribe Rates
Advertising & Marketing 20.5% 1.8% 9.0% 0.2%
Agriculture, Forestry, Fishing, Hunting 27.3% 3.4% 12.5% 0.3%
Consumer Packaged Goods 20% 1.9% 11.1% 0.1%
Education 28.5% 4.4% 15.7% 0.2%
Financial Services 27.1% 2.4% 10.1% 0.2%
Restaurant, Food & Beverage 18.5% 2.0% 10.5% 0.1%
Government & Politics 19.4% 2.8% 14.3% 0.1%
Healthcare Services 23.7% 3.0% 13.4% 0.3%
IT/Tech 22.7% 2.0% 9.8% 0.2%
Logistics & Wholesale 23.4% 2.0% 11.7% 0.3%
Media, Entertainment, Publishing 23.9% 2.9% 12.4% 0.1%
Nonprofit 26.6% 2.7% 10.2% 0.2%
Other 19.9% 2.6% 13.2% 0.3%
Professional Services 19.3% 2.1% 11.1% 0.2%
Real Estate, Design, Construction 21.7% 3.6% 17.2% 0.2%
Retail 17.1% 0.7% 5.8% 0.1%
Travel, Hospitality, Leisure 20.2% 1.4% 8.7% 0.2%
Wellness & Fitness 19.2% 1.2% 6.0% 0.4%


Behind the stats: In their 2021 report, CM Group (Campaign Monitor’s parent company) analyzed over 100 billion emails sent out across their platforms to derive their figures. Now that’s a lot of emails!

By email type…

  • Abandoned cart email open rates sit at nearly 49%. Barilliance

Stat spotlight

  • Welcome emails have an average open rate of 68.59%. GetResponse

Behind the stat: GetResponse — an Email Service Provider (ESP) — analyzed almost 7 billion messages out of over 35 billion emails GetResponse customers sent throughout 2021, and included only active senders with at least 1,000 contacts.

Email marketing ROI statistics

Overall

Stats spotlight

  • The more email marketing resources you have, the higher your ROI (42:1 email ROI for teams of 3-5, compared to 30:1 email ROI for teams of 2 or less full-time employees)
  • Email marketing has an average ROI of 3600%, or 36:1 – that’s $36 generated for every $1 spent. Litmus
  • Less than 13% of those surveyed stated they measured their email marketing ROI “well” or “very well”; 50% of respondents said they either did a poor job measuring or did not measure it at all.

Behind the stats: To derive these figures, Litmus surveyed over 2,000 marketing professionals worldwide in 2020. Those who reported measuring their ROI poorly (or did not measure at all) were excluded from the results — which makes a lot of sense, if you think about it! 

P.S. Don’t have a team of developers and designers at your disposal? With Dyspatch’s no-code, drag-and drop email builder, you can create beautiful, customizable, responsive emails in minutes — no technical knowledge required. 

ROI by email content type

  • Brands that use personalization increase email ROI by nearly 260% (43:1) compared to those who never or rarely do (12:1). Litmus
  • Marketers who A/B test their emails often increase email ROI by 86% (42:1) compared to those who never do (23:1). 
  • Brands that always include dynamic content increase email ROI by 100% (42:1) compared to those who never/rarely do (21:1).
  • Brands leveraging animated gifs increase email ROI by 105% (37:1) compared to those who never do (18:1).
  • Brands that use live content in their emails increase ROI by 107% (56:1) compared to those who never do (27:1).  

Industry-specific email ROI 

  • Retail, ecommerce, and consumer goods have an average email ROI of 45:1. 
  • Marketing, PR, and advertising agencies see ROIs of 42:1. 
  • Software and technology get a ROI of 36:1.
  • Media, publishing, events, sports, and entertainment have ROIs of 32:1.

B2B email marketing statistics 

  • The top priorities for B2B email marketers as of 2021 were to 1) communicate with customers, and 2) communicate with prospects. Validity

Metrics that have provided most insight into B2B content performance in the last 12 months

Source

Stats spotlight

  • Email newsletters were the second most popular content distribution channel for B2B marketers (87%), along with social media platforms (89%) and their organization’s website/blog (86%). Content Marketing Institute
  • The third most popular technology B2B organizations use for content marketing is email marketing software (78%).
  • Email engagement (e.g. opens, clicks, and downloads) is the second most common metric used by marketers (86%) to measure content performance.

Behind the stats: In 2020, Content Marketing Institute surveyed 740 content marketers from North America working at for-profit companies that primarily sell products/services to businesses and use more than one content type for marketing purposes. In 2019, 649 were surveyed using the same parameters.

B2C email marketing statistics 

  • The top priorities for B2C email marketers as of 2021 were to 1) generate revenue, and 2) communicate with customers. Validity
  • 40% of consumers report having at least 50 unread emails in their inboxes. Sinch
  • As of 2020, 60% of consumer goods and services companies are personalizing emails based on past purchases, versus 38% in 2019. Litmus

Stat spotlight

  • More than half (51%) of consumers prefer to be contacted by brands via email over any other channel. SmarterHQ Report

Behind the stat: In their Privacy & Personalization report, SmarterHQ surveyed over 1,000 consumers spanning from Gen Z’ers to baby boomers.

Customer retention email statistics 

  • In a survey, 86% of marketers said they relied on email marketing for customer retention. Emarsys
  • Over half (56%) of email marketers thought email marketing was the most effective customer retention strategy. Gigaom 

Bar graph comparing the percentage of marketers who rated various marketing programs as most effective for customer retention.Source

Stats spotlight

  •  41% of email marketers currently send re-engagement emails. Litmus
    • 25% didn’t as of 2020, but planned to in the future.

Behind the stats: Nearly 400 marketing professionals were surveyed by Litmus in 2020, including email and marketing specialists, team leaders, managers, directors, VP and C-level executives. Around 50% of respondents held leadership positions in their respective organizations.

Mobile email marketing statistics

  • Nearly 60% of all website traffic worldwide comes from a mobile device. Statcounter
  • 42% of all emails are opened on mobile devices. Litmus 
    • 67% of Gen Z’ers and 59% of millennials primarily use mobile email clients. Bluecore
  • Apple mail is the most popular mobile client. Litmus                                                              

Stat spotlight

  • 62% of recipients will delete or ignore an email due to difficulty reading from errors in mobile responsiveness. Dyspatch

Behind the stat: Yes, we’re proud to publish our own work! For our report on The Future of Email Marketing, we commissioned an online survey of 1,424 adults via SurveyMonkey, using a gender and age-normalized panel. The results reflect a representative sample of the United States.

Interactive email statistics

  • 60% of people are likely to engage with an interactive email. Dyspatch
    • More than 50% say they like it when they can interact with content right inside an email. 

Video in email marketing statistics

  • In 2019, video was the number one form of media used in content strategy, overtaking blogs and infographics. Hubspot

Stat spotlight

  • In 2022, 87% of marketers report a positive ROI resulting from using videos, whereas in 2015, only 33% agreed. Wyzowl

Behind the stat: Wyzowl produced their eighth annual Video Marketing Statistics report using data collected from 582 unique respondents in December 2021. The trend data is based on eight years of asking the same questions, beginning from 2015.

AMP for Email statistics

  • Google Docs AMP emails resulted in a 500% increase in engagement. Alite International
  • AMP emails generated 5.2x more survey responses than HTML emails. AMP Project
  • Razorpay improved their survey response rate by 257% with AMP,  increasing engagement on product awareness campaigns by 45% and converting 87% more merchants to the platform. AMP Project

AMP emails are on the cutting edge of innovation, but there’s not a ton of data out there yet. That’s why we’ve provided info on several case studies in our AMP for Email white paper that showcase the successes of AMP. (And you can create engaging, frictionless experiences too with our pre-coded, AMP-powered library of Apps in Email!)

Stat spotlight

AMP emails increase recovered sales by 82% on average (as high as 300% in some cases). AMP Project

Behind the stat: Between July and November 2019, Ecwid analyzed ~171,000 merchant emails, testing and comparing the performance of AMP abandoned cart emails and traditional static emails.

Email accessibility statistics

Making sure that your emails are accessible isn’t only the right thing to do, it will also make sure that you reach the widest audience. 

2023 State of Marking Report - Hubspot

  • The World Health Organization estimates there are around 2.2 billion people with visual impairments.
  • There are an estimated 300 million people globally with color blindness, affecting approximately 1 in 12 men (8%) and 1 in 200 women (0.5%).
  • Up to 20% of the population deals with some level of dyslexia.

While 77% of brands say that making their emails more accessible is a priority, only 8% say they follow best practices for email accessibility in all of their campaigns. - Hubspot

Stats spotlight

  • Emails with personalized subject lines generate 50% higher open rates. Yes Lifecycle Marketing
    • 58% higher CTORs

Behind the stats: In a 2017 report, Yes Lifecycle Marketing analyzed more than 7 billion emails sent through its cross-channel communications platform and compared the results shown between personalized and non-personalized emails.

Pecentage comparison of marketers describing which tactics their company's use for email marketing.

Stat spotlight

  • As of 2019, 66% of consumers are willing to share more data for more personalized experiences. Accenture 
  • In 2023, personalization with relevant and empathetic messaging has become a necessity. Validity

Behind the stat: Accenture surveyed 6,000 consumers from Europe — where tighter privacy regulations apply — about their preferences when it comes to brands, retailers, and service providers.

Email accessibility statistics

Making sure that your emails are accessible isn’t only the right thing to do, it will also make sure that you reach the widest audience.

  • 2023 State of Marking Report - Hubspot
  • The World Health Organization estimates there are around 2.2 billion people with visual impairments.
  • There are an estimated 300 million people globally with color blindness, affecting approximately 1 in 12 men (8%) and 1 in 200 women (0.5%).
  • Up to 20% of the population deals with some level of dyslexia.

While 77% of brands say that making their emails more accessible is a priority, only 8% say they follow best practices for email accessibility in all of their campaigns. - Hubspot


The future of email marketing statistics 

So there you have it! The highest quality collection of email marketing statistics we’ve hunted down and quadruple-checked.

Seriously. Quadruple. It took a while!

And while I’m hoping you found these as accurate, relevant, timely, and useful as I did, be warned: the stats are always evolving.

So, if you want the latest email marketing information from the highest caliber of sources, subscribing to our newsletter is a fantastic place to start. We send out well-researched articles and recommendations weekly based on the most updated facts and figures, along with informative articles about how you can up your email marketing ante. 

Oh yeah, and we’ll never overload you. Your inbox sanctity is safe with us.

The Email Builder that Global Brands Love

Learn more

Jessie Strongitharm

Creative communicator. Passionate about wordsmithery and technocultural inquiry. Content Writer at Dyspatch.

  • LinkedIn

    Related Posts

  • Email Marketing Metrics: Which Ones Really Matter?
  • Dynamic, Interactive, and AMP Emails: What’s the Difference, Anyway?
  • What is really required for unsubscribes? And other legal requirements, demystified
Tags: Email Marketing Articles
Share this post:
  • Facebook
  • Pinterest
  • Twitter
  • Linkedin
LET’S CHAT!

Why wait? Take your email marketing to the next level today.

Get a demo
Dyspatch Logo

5307 Victoria Drive #899
Vancouver, BC
V5P 3V6

548 Market Street,
San Francisco, California
94104 US

  • Phone 1-877-458-9231
  • Email us@dyspatch.io
    security@dyspatch.io
  • Facebook
  • Twitter
  • Instagram
  • LinkedIn
  • YouTube

Get the latest email strategies, tips, and trends right to your inbox.

About Dyspatch

  • About us
  • Careers
  • Contact us
  • Pricing
  • Press & Media
  • Release Notes

Find your fit

  • Tools for email Designers
  • Dyspatch for translators
  • Email production for Marketers
  • Resources for email Developers

Features

  • Dyspatch overview
  • No-code email builder
  • Email collaboration
  • Email template localization
  • AMP for Email
  • Sample AMP email templates
  • Expert Services
  • Sendwithus Overview
  • Agency Program

Email resources

  • Blog
  • Webinars
  • Ebooks Guides & Reports
  • HTML email templates
  • Knowledge base
  • Figma email builder
  • The Dyspatch Block gallery

Integrations

  • Partners & Integrations directory
  • Email builder for Braze
  • Email builder for Iterable
  • Email builder for Salesforce Marketing Cloud
  • Email builder for Pardot
  • Email builder for SendGrid
  • Email builder for Marketo
  • Email builder for HubSpot
  • Email builder for Oracle Eloqua

Dyspatch respectfully acknowledges the Lekwungen and W̱SÁNEĆ People, whose unceded territories we live and work on. We would also like to express our gratitude to all of the Coast Salish people as we continue to work and live as guests on their lands.

We recognize that acts of colonization created many inequities for First Nations, Inuit, and Métis people. As a company, we acknowledge that we have a responsibility to work towards reconciliation and to remain open to suggestions and consultations, especially with Indigenous communities.

Privacy policy    |    Terms of service    |    Web accessibility    |    Cookie policy    |    Usage    |    Sitemap

Copyright © 2025 Techdrop Labs Inc. All Rights Reserved.


Features & Functionality
Starter Teams Teams+
Universal styling  ✓  ✓  ✓
Drag and drop email builder  ✓  ✓  ✓
Custom code editor  ✓  ✓  ✓
Custom fonts  ✓  ✓  ✓
Device specific elements  ✓  ✓  ✓
Version history  ✓  ✓  ✓
Social media link settings  ✓  ✓  ✓
Commenting  ✓  ✓  ✓
Live previews  ✓  ✓  ✓
Dark mode previews  ✓  ✓  ✓
Litmus testing  ✓  ✓  ✓
Custom merge fields  ✓  ✓  ✓
Image hosting  ✓  ✓  ✓
Brand & legal compliance guardrails  ✓  ✓  ✓
User role permissions  ✓  ✓  ✓
ESP logic  ✓  ✓  ✓
Code Export  ✓  ✓  ✓
AMP Email Support  ✓  ✓  ✓
Approval Workflows  ✓  ✓  ✓
API Access  ✓  ✓  ✓
User Management –  ✓  ✓
Translation (via Smartling) – –  ✓
Export via API – –  ✓
Localizations – –  ✓
Account Manager – –  ✓
Premium Support – –  ✓
SLA – –  ✓
Premium SAML SSO – –  ✓
Custom Themes – –  ✓
Workspaces – –  ✓
Design / AMP Services – –  ✓
Pricing $149/mo $499/mo Custom
Get a demo

Get a quote